


What Would You Do Differently If You Could See Your Whole Business at a Glance?
There’s a question I like to ask small business owners when I first speak to them.
“If you could see – right now, in one place – exactly which products are making you money, which months are your busiest, and which sales platform is actually worth your time… what would you do differently?”
The answers are always interesting. And they’re almost always the same.
“I’d stop making so much of the thing that clearly isn’t working.” “I’d start preparing for Christmas in September instead of panicking in November.” “I’d put my energy into the platform that’s actually earning me money.”
The decisions are obvious. The problem is never knowing what decision to make. The problem is not having the information to make it with.
Running a business without the full picture
When you start a small business, you’re brilliant at the thing you sell. Whether that’s handmade candles, personalised gifts, clothing, illustrations, food products – you know your craft inside out.
What nobody prepares you for is the data side of things.
Not the accounts – there are accountants for that. Not the tax return – there are tools for that too.
The everyday business intelligence bit. The “which of my six products should I actually be focusing on” bit. The “is my TikTok shop worth the effort I’m putting into it” bit. The “why did March feel so quiet when I thought spring was supposed to be busy” bit.
These questions don’t have obvious answers when your sales data is split across three platforms, your costs are in a notebook somewhere and your fees are buried in a payment statement you haven’t opened since January.
What changes when you can see everything in one place
Let me paint you a picture of what using a proper business dashboard actually looks like day to day.
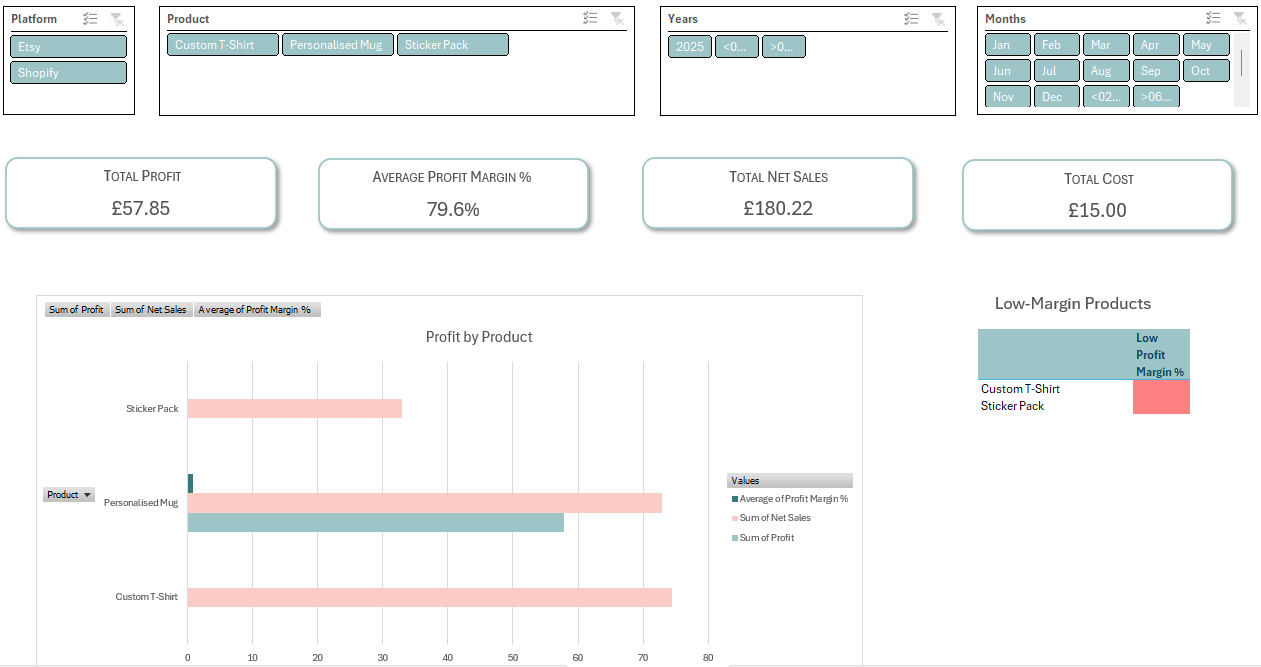
It’s a Monday morning. You’ve had a busy week of orders. You open your dashboard, click refresh, and in about two minutes you can see:
Your total revenue last week – not the gross figure your platform shows you, but the real figure after fees.
Your profit – broken down by product, so you can see at a glance which items are pulling their weight and which ones are quietly underperforming.
Your seasonal pattern – a visual map of which months have historically been your strongest, so you’re never caught off guard by a slow period or unprepared for a spike.
Your platform breakdown – if you sell on more than one platform, a clear comparison of which is earning the most, which has the best margin, and which might not be worth the effort you’re putting in.
All of that. Monday morning. Two minutes. No spreadsheets, no calculations, no guesswork.
That’s what a business dashboard does.
The decisions that become easy
Here’s what I’ve noticed about the small business owners who start using a dashboard properly.
They stop making decisions based on what feels right. Not because gut feeling is always wrong – it often isn’t. But because when you have the data in front of you, you don’t need to guess. You know.
Some of the most common things that shift:
Pricing. When you can see your true profit per product – after every fee, every cost, every material – you know immediately whether your pricing is working or whether you’ve been undervaluing what you make. Most sellers who run this calculation for the first time find at least one product that needs repricing.
Stock decisions. When you can see your seasonal patterns clearly, you stop being reactive and start being prepared. You’re not ordering more materials in a panic two weeks before Christmas. You’re doing it in September because the data told you September is when you need to be ready.
Platform focus. When you can see side by side which platforms are generating the most revenue and the best margins, you stop spreading yourself equally thin across everything and start putting your energy where it actually pays off.
Knowing when to worry and when not to. A quiet week feels very different when you can look at your dashboard and see that the same week last year was quiet too. Pattern recognition is calming. It replaces anxiety with context.
This isn’t just for big businesses
One of the most persistent myths about business dashboards is that they’re for companies with data teams and IT departments and budgets that would make a small business owner’s eyes water.
They’re not. Or at least, they don’t have to be.
The Clarity Dashboard Bundle is built in Excel – software that most people already have on their computer. It connects directly to your platform exports, cleans them up automatically and produces a clear, visual dashboard that works for a one-person Etsy shop just as well as it does for a seller operating across five platforms.
There are no formulas to write. No data skills required. No monthly subscription.
You set it up once – takes less than an hour – and then you use it every time you want to see what your business is telling you.
Back to the question
What would you do differently if you could see your whole business at a glance?
Whatever your answer is – that’s the thing your dashboard makes possible.
Not by doing the work for you. But by showing you clearly enough what’s happening so you know exactly what work needs doing.
The information is already there. It’s in your platforms, your order history, your sales records. A dashboard just puts it somewhere you can actually see it.
Want to see your business clearly for the first time? The Clarity Dashboard Bundle works with Etsy, Shopify, TikTok Shop, Faire, WooCommerce and more. One payment, yours to keep. Find out more
Start smaller – download the free calculator: See your true profit per product in minutes, completely free. Get it here